Now that we are aware of the hot box and the problem definition for hot box analysis, in the second part of the article, we will have some insight into the simulation.
The Study – Ready to dive deep?
Based on the understanding of the problem and the probable solution, various analysis cases are performed. To demonstrate the effect of convection and radiation, an incremental approach in including the heat transfer modes in the analysis is adopted. In the first case, conduction heat transfer is considered, ignoring radiation, convection and insulation. In the second case, conduction is considered along with insulation on the skirt. In the third case, radiation is considered along with conduction. This is a widely adopted method to analyze hot boxes. In the fourth case, a separate analysis is performed to study the effect of convection along with conduction. In the fifth case, all three modes of heat transfer are considered.
Temperature Distribution:
A uniform temperature of 400 °C is considered at the inner wall of the vessel, while the other temperature boundary conditions are as per the respective case. The convection properties of ambient air of 20E-06 W/mm2-°C at 22°C are assigned to the insulation exposed to the environment in Case 2 to Case 5 and to the skirt outer side in Case 1. The radiation is applied with an emissivity of 0.8 in Case 3 and Case 5. The air in the hotbox will achieve steady-state condition after the temperatures in the vessel are stabilized. Also, there is no opening in the hot box which can provide a velocity to the air. Hence, air can be assumed to be stagnant. Considering this condition, the air is assumed to be stagnant and modelled as solid with conduction properties assigned. It is important to note here that the convection mentioned is actually the conduction through the stagnant air in the hot box.
The temperature distribution in each case is observed to study the contribution of different modes of heat transfer on the temperatures. The distribution in Case 1 is shown in Figure 1. The temperature drop is approximately 200 C in a span of about 200 mm, which is very sharp.
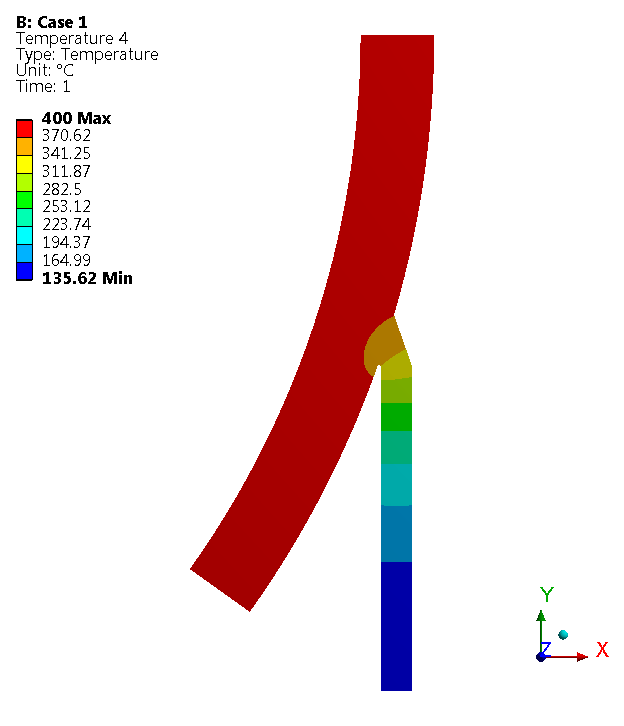
Figure 1: Temperature Distribution (in °C) – Case 1
The case 2, 3 and 4 temperature distributions are compared in Figure 2.
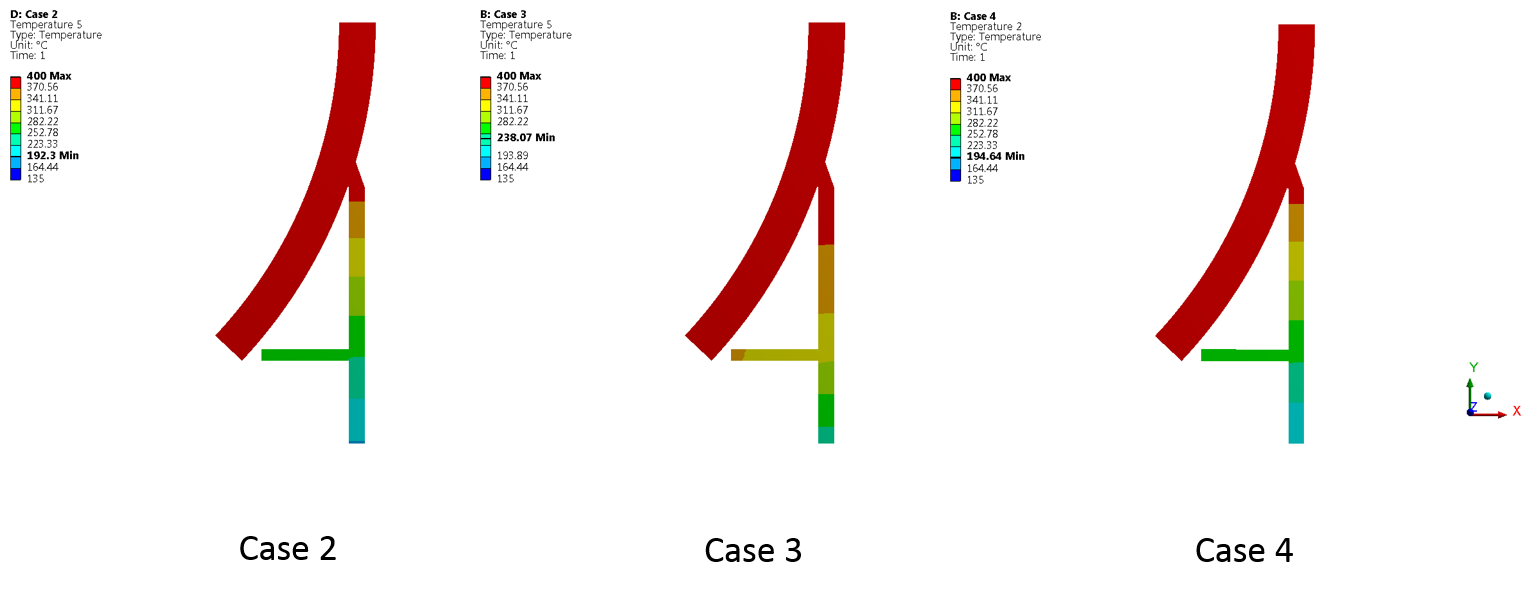
Figure 2: Temperature (in °C) – Case 2, 3 and 4
The temperature distribution with all the three modes of heat transfer considered is shown in Figure 3.
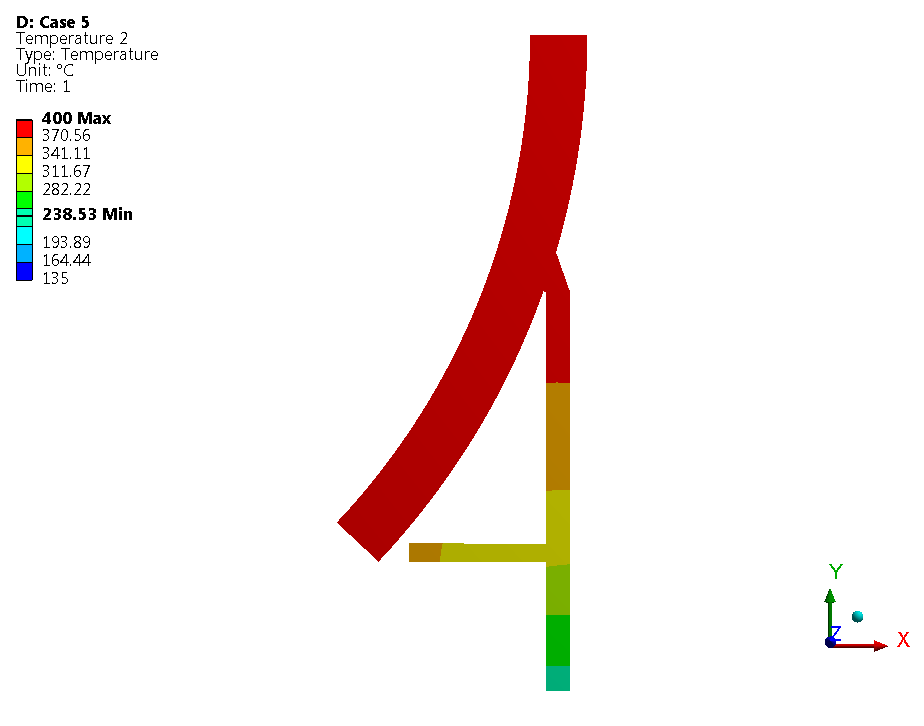
Figure 3: Temperature Distribution (in °C) – Case 5
For comparison, the maximum and minimum temperatures in all the cases are shown in Figure 5 and the values are presented in Table 1.
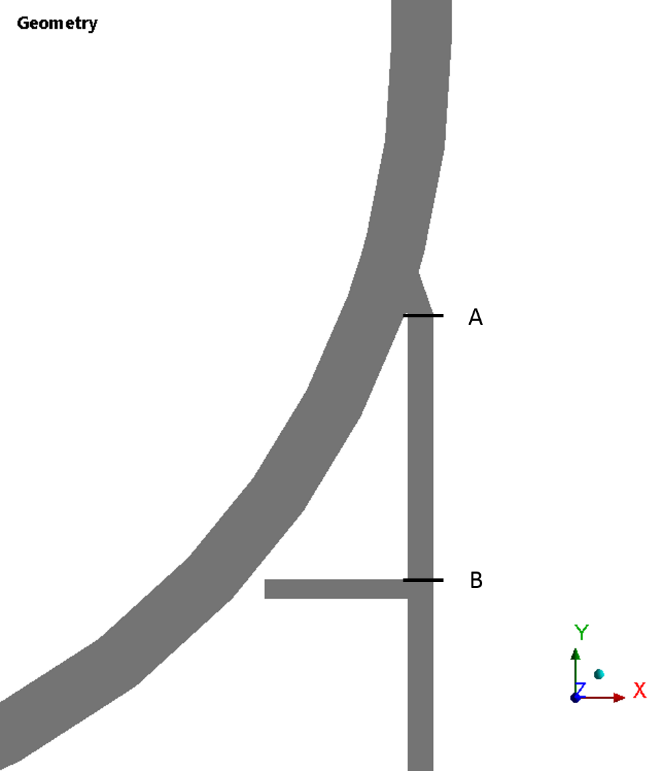
Figure 4: Locations of Points in the Region of Interest
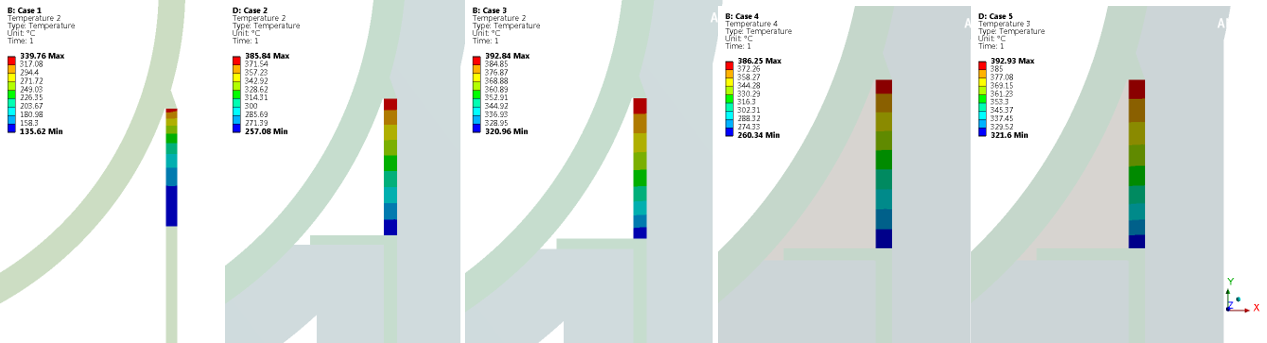
Figure 5: Temperature Distribution (in °C) – Hot Box at Skirt
Table 1: Temperature (in °C) at Top and Bottom of Hot Box in Skirt
| Location | Case 1 | Case 2 | Case 3 | Case 4 | Case 5 |
| Top (A) | 339.76 | 385.84 | 392.84 | 386.25 | 392.93 |
| Bottom (B) | 135.62 | 257.08 | 320.96 | 260.34 | 321.60 |
| Difference | 204.14 | 128.76 | 71.88 | 125.91 | 71.33 |
The actual temperature difference in this span of about 200 mm is only 71.33 C as against the 128.76 C when neglecting convection and radiation. The temperature at the bottom of the skirt is minimum in Case 5 which considers all three modes of heat transfer. There is only a marginal difference in the temperatures in Case 3 and Case 5. However, the effect of this difference can be seen in the thermal stresses caused due to the temperature distribution.
Stress Distribution:
Static structural analysis is performed to evaluate the stresses in the hot box with the temperature distribution obtained in the thermal analysis. The stress distribution near the junction of shell and skirt for all the cases is shown in Figure 6.
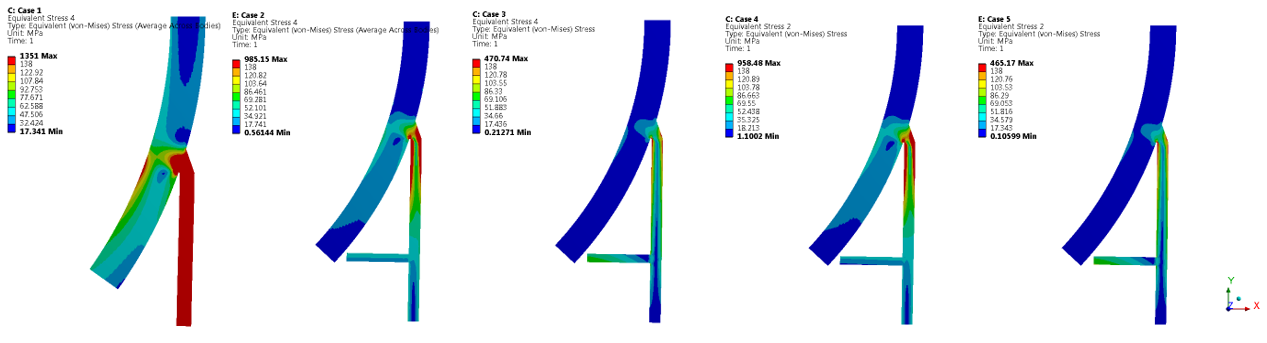
Figure 6: Equivalent Stress Distribution (in MPa) – Comparison
The stress distribution plots show that in case 3 and case 5 due to the decrease in temperature gradient, i.e. increase in temperature at point B, the stresses are decreased. The difference in stresses is not huge but becomes significant when there is a borderline scenario during the qualification process as per ASME Section VIII, Div. 2. Also, the stresses are secondary in nature and become of significance when the vessel is subjected to cyclic loading, resulting in a much lesser life. A small change in the alternative stress value can change the fatigue life significantly.
In summary, the hot box is a simple solution to reduce the temperature gradient in the skirt to shell junction. Due to the nature of the hot box configuration, radiation, as well as convection, play a role in the heat transfer along with conduction. The region of interest in this study is the hot box, and the actual heat transfer in this region takes place by all three modes, i.e. conduction, convection and radiation. Hence it is imperative to consider all these modes in the analysis. The above cases are not the actual scenarios, but they demonstrate the effect of heat transfer modes separately. Out of the three modes, conduction remains the most significant mode and hence must be included in all the cases of study. Convection and radiation can only take place when we have the initial temperature gradient due to conduction. Case 5 includes all the three modes of heat transfer and hence the most near to actual condition.
Next time when you are simulating the hot box, rethink if you have considered all the factors influencing the stresses.
0 Comments